
To see the breakdown of Markus Wheaton, Terrance Williams, Quinton Patton and Justin Hunter:
The wide receivers in this class are an intriguing bunch to say the least. Just like the quarterback class, there is no consensus best receiver in the draft. Unfortunately this makes it harder for teams and fans to predict the draft, but makes for much more interesting statistical analysis. Instead of simply proving that AJ Green is the best WR in the class, we get to try to figure it out. Is Keenan Allen really the best WR in the class? Was Patterson better than his teammate, Justin Hunter? These are the type of questions we can answer.
Similar to the quarterbacks, I went through these player’s games and marked down a variety of factors. I noted where they caught the ball, how many yards they picked up after the catch and more. Statistics don’t tell the whole story, but now when someone tells you that a certain wide receiver is a beast at picking up yards after the catch – you’ll know better. For the purposes of this post, I’ve considered the top 4 wide receivers as Keenan Allen, DeAndre Hopkins, Cordarrelle Patterson and Stedman Bailey (you’ll see why).
Where Are They Catching the Ball?
I promise this will be the only chart like the one in the QB post, the rest aren’t so similar. This represents what zones they caught the ball in, before yards after the catch. Unfortunately, I don’t have the exact routes or what side of the field they caught it on. That will have to wait until the next iteration of this.
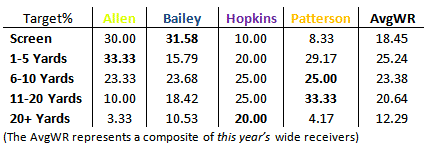
- Keenan Allen lives on the short passes. 63.3% of Allen’s passes were caught within 5 yards of the line of scrimmage. Only 3.33% of his passes were past 20 yards. A low for all WRs I looked at. This may not be a bad thing if his yards after the catch are good.
- Stedman Bailey’s game consisted of a lot of screens. Unlike Keenan Allen though, we see a much more distributed catching range. 18% of his passes were caught in the 11-20 yard range with 10.5% deep catches.
- Surprisingly, Hopkins was a major deep threat. This surprised me because I thought of Hopkins as a guy who ran a lot of curls and mid-range outside routes. We see that 70% of his catches were past 6 yards. The highest in the major WRs for this class, excepting Terrance Williams
- Patterson’s numbers are just interesting. We don’t see many passes caught past 20 yards, but 33% of his passes were caught in the 11-20 yard range. It’s like he decided to ignore catching the ball in the screen and 20+ yard game and just catch intermediate passes.
What’s Happening After the Catch?
This chart represents the yards from the LOS that they caught the ball before YAC and then the yardage after the catch in the second bar.
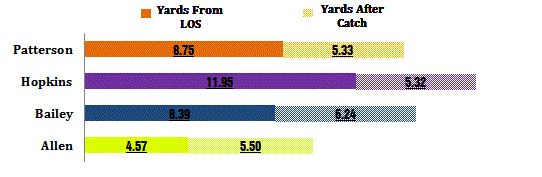
- DeAndre Hopkins shows us how much deeper he caught the ball than the others. On average he caught the ball 12 yards from the LOS, before YAC.
- Stedman Bailey’s yards after the catch is great. In this class, most WRs YAC hovers around 5.3-5.5 yards. Bailey’s is the highest at 6.24. Even though 33% of his catches were screens, having good yard after the catch skills makes it worthwhile.
- Allen’s numbers are not so superb. On average he caught the ball 4.57 yards from the LOS. This is 3 yards lower than the next wide receiver (Quinton Patton). Plus his yards after the catch is simply average
How Did Their Systems Help/Hurt Them?
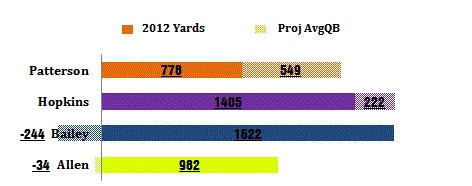
This one is going to require a little explaining. I didn’t just chart their catches, I charted every pass thrown to each wide receiver. In that, I was able to derive how often a QB targets his number one wide receiver and how often QBs miss their wide receiver. Thus I averaged out the percentage of targets, miss percentage, and average amount of throws per game, to give each WR the same amount of targets. Then I adjusted to see how their season numbers would have been, had they been in an average system.
- Patterson is helped by this the most, by far. First off, Tyler Bray was just bad in terms of missing his wide receivers. However, Patterson was also targeted far less than a normal number 1. Had he been targeted at the same rate, he would have gained 549 yards, for a season total of 1327 yards. There were certainly be no questions about his production with those numbers.
- Bailey incidentally is hurt by this. This of course is due to the high powered passing offense of West Virginia. I don’t think this drops Bailey’s value at all, because he’d still have 1378 yards, but it shows you the influence of WV’s offense.
- Hopkins numbers would be obscene with more targets. He’s looking at north of 1600 yards with more targets, this of course is due to his high average catch distance.
- Allen’s numbers remain mostly unchanged. This means in terms of targets and misses, Allen represents the average number 1 WR. I understand Maynard wasn’t the best QB and it doesn’t take into account sacks and whatnot, but it’s a start.
*One final note on all of this. I realize this is imperfect. Would Hopkins have been as much of a deep threat without Tajh Boyd? Thus if he had a different QB, would he have caught as many deep passes with more targets? Possibly. I’m trying to work on a way to solve this, but this is my first pass at the WRs.
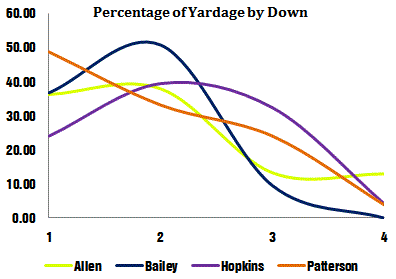
I’m going to present a few more charts without comment. You’ll find drop percentage, yardage by quarter, yardage by down, red zone yardage.
**If you’ve liked this, you can follow me at Follow @NU_GapSince I just started this up, I’m working to get the info out to people. I do work pretty much every day breaking down prospects and I’ll be tweeting out interesting stats that I come across (today I found out Justin Hunter drops ~10% of his passes), future articles/breakdowns (Dysert, Nassib, Manuel post upcoming), or let you know when I post new things (a specific post on Tavon Austin, for instance) . Thanks a lot!


**Thanks to @CKParrot for inspiring this stat, helps to show ability to create after the catch when on their own

*This one was extrapolated from a 6 game set of data, thus it won’t be perfect, but it’ll give you a feel for each WR

Kevin
February 5, 2013
I’d love to see some stuff on Tavon Austin. Good stuff though. Thanks!
nugap
February 5, 2013
I’ll be doing a separate post in the coming weeks on Tavon. His running/ catching ability should be broken out on its own. Stay tuned here or you can follow on Twitter @NUGap, where I’ll be posting about upcoming articles/ sharing stats as I break them down. Thanks for reading.
Keith
February 5, 2013
Very interesting breakdown. Just a couple of comments. For one, you have to wonder what Tennessee was thinking to not get Cordarrelle Patterson more involved on screen passes with his running ability. Second, and I’m not sure how you can take this into account numerically, YAC gives us a good view on a receiver’s ability to make yards after he catches the ball, but the accuracy of the quarterback plays a big role in that. For instance, of the four wide receivers on this list, Stedman Bailey had the more accurate quarterback on passes that are in the zones where the majority of passes are thrown (1-20 yards). If he’s catching the ball in a better position to gain YAC yards, then his yards should be higher.
Conversely, I’m not sure I saw a more inaccurate quarterback than Zack Maynard at California. IMO, the fact that Keenan Allen has a 5.50 YAC average is pretty remarkable considering that he rarely caught passes that hit him in stride. A lot of his routes were what you thought you would see from DeAndre Hopkins, curls and stops and such.
nugap
February 5, 2013
Next few days I’m hoping to normalize passes to certain zones, thus make every receiver catch a certain number of balls in each zone and use their YAC/ catches in the air to determine their yardage. Again, it’s not perfect, but it might give you a feel for how Patterson would have done.
Absolutely you can’t. That’s one of the main reasons I don’t ever advocate using stats as a main evaluation method. Too many people go, well this guy has YAC problems so we shouldn’t draft him. I try to be careful not to say things like that because there are so many factors. Interestingly, from the stats I collected on their QBs while I was getting data, Tyler Bray and Mannion missed their WRs far more than Maynard. Doesn’t mean Maynard’s ball placement wasn’t off, those are just total misses.
It’s possible in the next iteration (like next draft) I’ll try to account for where the ball is throw to the WR, but that’s going to be totally subjective like drops are. You can come up with a standard for what counts as “bad placement” but it’s always going to be in the eye of the beholder. Anyway, these stats more than anything are meant to confirm/ deny what you see on tape or help you find any good or bad trends. I find fault with anybody who tells you they can’t use stats at all or anyone who tells you they should only use stats. I’m glad you’re here reading and know your real-life stuff. Anyway, thanks for reading, I’ll have more WRs up in the future for sure.
mark_b
March 29, 2013
Your failure to include WRS/KR-Austin and WRF/WRP/WRS-Swope in bewildering.
nugap
March 29, 2013
I did a separate post for Tavon Austin: http://secondroundstats.com/2013/02/14/breakdown-austin/ Which actually breaks him down in even more depth. I also wrote this before all of the Ryan Swope hype came about. I still wouldn’t put him in the first tier, but second tier wouldn’t be out of the realm of possibility. It’s still possible I’ll write him up before the draft.