
Previously: Tier 1 CB Breakdown, Dee Milliner, Xavier Rhodes, Johnthan Banks
In my tier 1 CB breakdown before of Xavier Rhodes, Dee Milliner and Johnthan Banks before the combine, I noted that any of the second tier corners could be better than the tier 1 prospects. Although I didn’t have the stats to prove it at the time, the media tide has turned with some saying that both Desmond Trufant and Darius Slay could be better than Banks. The numbers reveal some interesting things about Trufant, Poyer and Slay. Each CB has a few positives, but they also have some deficiencies. Whether those are related to where they were aligned before the snap or a lack of experience in certain coverages, you can make the case that each CB listed here is deficient in some way compared to the “tier 1” guys.
Charting CBs takes a long time, so I used a 4 game sample for each of these players. I’m happy with the sample and think it captures each CB pretty well. As always, these stats aren’t meant to prove that X player is better than Y player. However, they will complement what you see on film and can cause you to take a second look at something you hadn’t questioned. No stats are perfect, but these should give you a good feel for each CB.
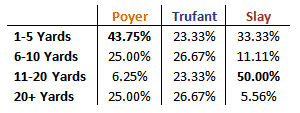
Where Were They Targeted?
These are the locations in which the cornerbacks were targeted. That is, it includes all outcomes such as completions, pass interference, deflections, etc.
- Just like the tier 1 CBs, Poyer, Trufant and Slay were targeted at a high level in the short ranges. This is due to a prevalence of passes in the short game, including swing passes and quick routes near the LOS. Trufant’s 23.3% is the lowest of all CBs including the tier 1 corners.
- Interestingly, Trufant was targeted almost equally amongst each zone. His 26.67% challenge rate deep is the highest of all the CBs in this class. That makes you wonder why quarterbacks chose to challenge him deep so often? Did they feel they could beat him or is that more of the style in the PAC-12?
- An incredible 50% of Darius Slay’s targeted were in the 11-20 yard range, but only 5.6% past 20 yards. There is obviously a discrepancy there, indicating that Slay could be weak in what many consider the “NFL zone” of throws.
- Nearly 69% of Poyer’s targets came in the 1-10 yard range, this is likely due to the type of routes he often covered from the slot (we’ll get to that in a bit)
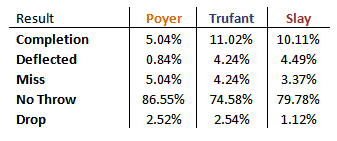
What Happened After They Were Targeted?
All of these are a function of total passes, not just targets. Thus 100 minus the percentage of No Throw would equal how often they were targeted. I’ve taken out interceptions, thus it won’t add to 100%.
- Poyer was targeted on only 13.5% of all passes. This is the lowest of all CBs, edging Xavier Rhodes by 1.5% (Rhodes was ~15%). I’m slightly dubious about this number because Poyer covered the slot nearly 40% of the time. While some schools like Texas A&M put their best receivers like Ryan Swope in the slot, I’m not sure that’s always the case. Is this number inflated because Poyer was covering number 2 and 3 wide receivers? You can see the alignment numbers below.
- Trufant on the other hand was targeted roughly 25% of the time, or the highest of all the CBs in this class. Despite this, his completion level is still lower than other CBs like Banks and Milliner. That means, QBs were targeting him but not completing their passes. This is in part due to his ability to play the ball.
- Slay has very similar numbers to Johnthan Banks. Both were targeted on roughly 20% of all passes. However, Slay had less passes completed on him, with 10% of all passes being completions. He also deflected the most passes out of this CB class. Combine that with his 5 interceptions this year and it shows a good nose for the ball.
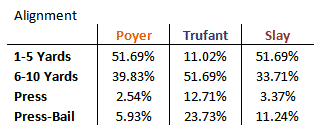
Where Did They Line Up?
Even though we know where they were targeted, what technique were they playing? While I didn’t try to decipher the playbooks to figure out the coverages, I at least noted where they were aligned pre-snap. As a note, the CBs had to get their hands on the WRs to count as press coverage. The yardage refers to how far they were from the line of scrimmage.
- I find the lack of press played by Slay and Poyer interesting. Johnthan Banks pressed the least in the first tier and he played press 8% of the time. Poyer and Slay only played press 3% of the time. That’s essentially negligible. That doesn’t mean they can’t be taught, but it makes you wonder if they can make a jump to a press scheme easily.
- Trufant either played far off the line of scrimmage or near it, nothing in between. Trufant played press coverage 12% of the time, third highest for this class of CBs. He bailed on press another 24% of the time, giving him experience close to the line. However, he only lined up 1-5 yards off the LOS 11% of the time.
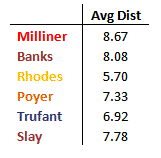
Average Distance of Completions
This is simply the average distance in yards of a completion against each CB. Note that these are before yards after the catch.
- Trufant had the lowest average distance of completions of tier 2 and the second lowest amongst all CBs despite being targeted deep often.
- Slay and Poyer are sitting between 7 and 8 yards which would still put them lower than Banks and Milliner.
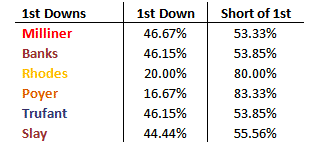
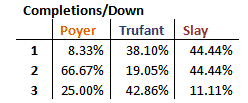
Here are a few other charts that I’m not even going to bother commenting on. If you’ve liked this, you can follow me at Follow @NU_Gap. I do work pretty much every day breaking down prospects and I’ll be tweeting out interesting stats that I come across , future articles/breakdowns, or let you know when I post new things . Thanks a lot!
Mike
March 4, 2013
Great breakdown, I hope you continue it and analyze Jamar Taylor, Logan Ryan, and Blidi Wreh-Wilson as well.
Goat Sampson
March 13, 2013
2nd for those 3, especially Wreh-Wilson who seems to be jumping up boards.